I have a new job. In a new country. In a new domain.
But it’s still me, luckily. And I bring the knowledge and tools that I know and have used from other domains. I have often thought that the IT industry was special. that projects in our environment were much more complicated than in any other environment. That we had special communication problems that only occurred here.
I’m now starting to change my mind. Of course, I cannot talk TDD and Specification by example with these people, but there are many universal things that will help you: focus on lead times and doing fewer things at the same time, get people together in the same room, visualize your problem to get a better and common understanding of it. Things like that.
In this post I’ll describe how we used three (Root cause analysis, Impact mapping, and Limit WIP) of the tools that I’ve picked up during the latest years to help a struggling hospital director to get a solid understanding and a plan for how to proceed.
Introduction
The hospital director is a very young (28?) woman doctor who was promoted because “we had no one else”. She has no management training and was given a hospital that is in terrible condition, with a lack of motivation among the staff, and a bleak economical future to say the least.
Not a very envious situation, but she has will power and really wants to do something about this. I thought I’d try to help her get an action plan in order, since like for many of us in this situation, she wanted to do everything at once.

This is not a blog post that will end with “… and now they are the richest hospital in Indonesia and the doctor has gone on to win the Noble prize in management”. There will be no victory dance. We’re not there.
Yet.
I just wanted to show how we applied the ideas with these tools in a very different domain from what it was first intended for.
Root cause analysis
So, where do we start? At first, I thought that was a really hard question to answer. There were so many problems. But then I came to think about Root Cause Analysis and how that from time to time have led me to see how problems are related to each other.
One of the things that they (the hospital management group) often came back to was that the BOR (Bed occupancy rate, number of patients in the hospitals / number of available beds) was low. About 20-30% of their capacity. So, even though I did know that they had A LOT of other problems I suggested that we start with that. They were so bogged down so they didn’t mind: “Yeah, that’s one of the things that we need to look at…”
As the exercise unfolded I came to realize that Root Cause Analysis not is a problem solving tool - it’s a problem understanding tool. More on that soon.
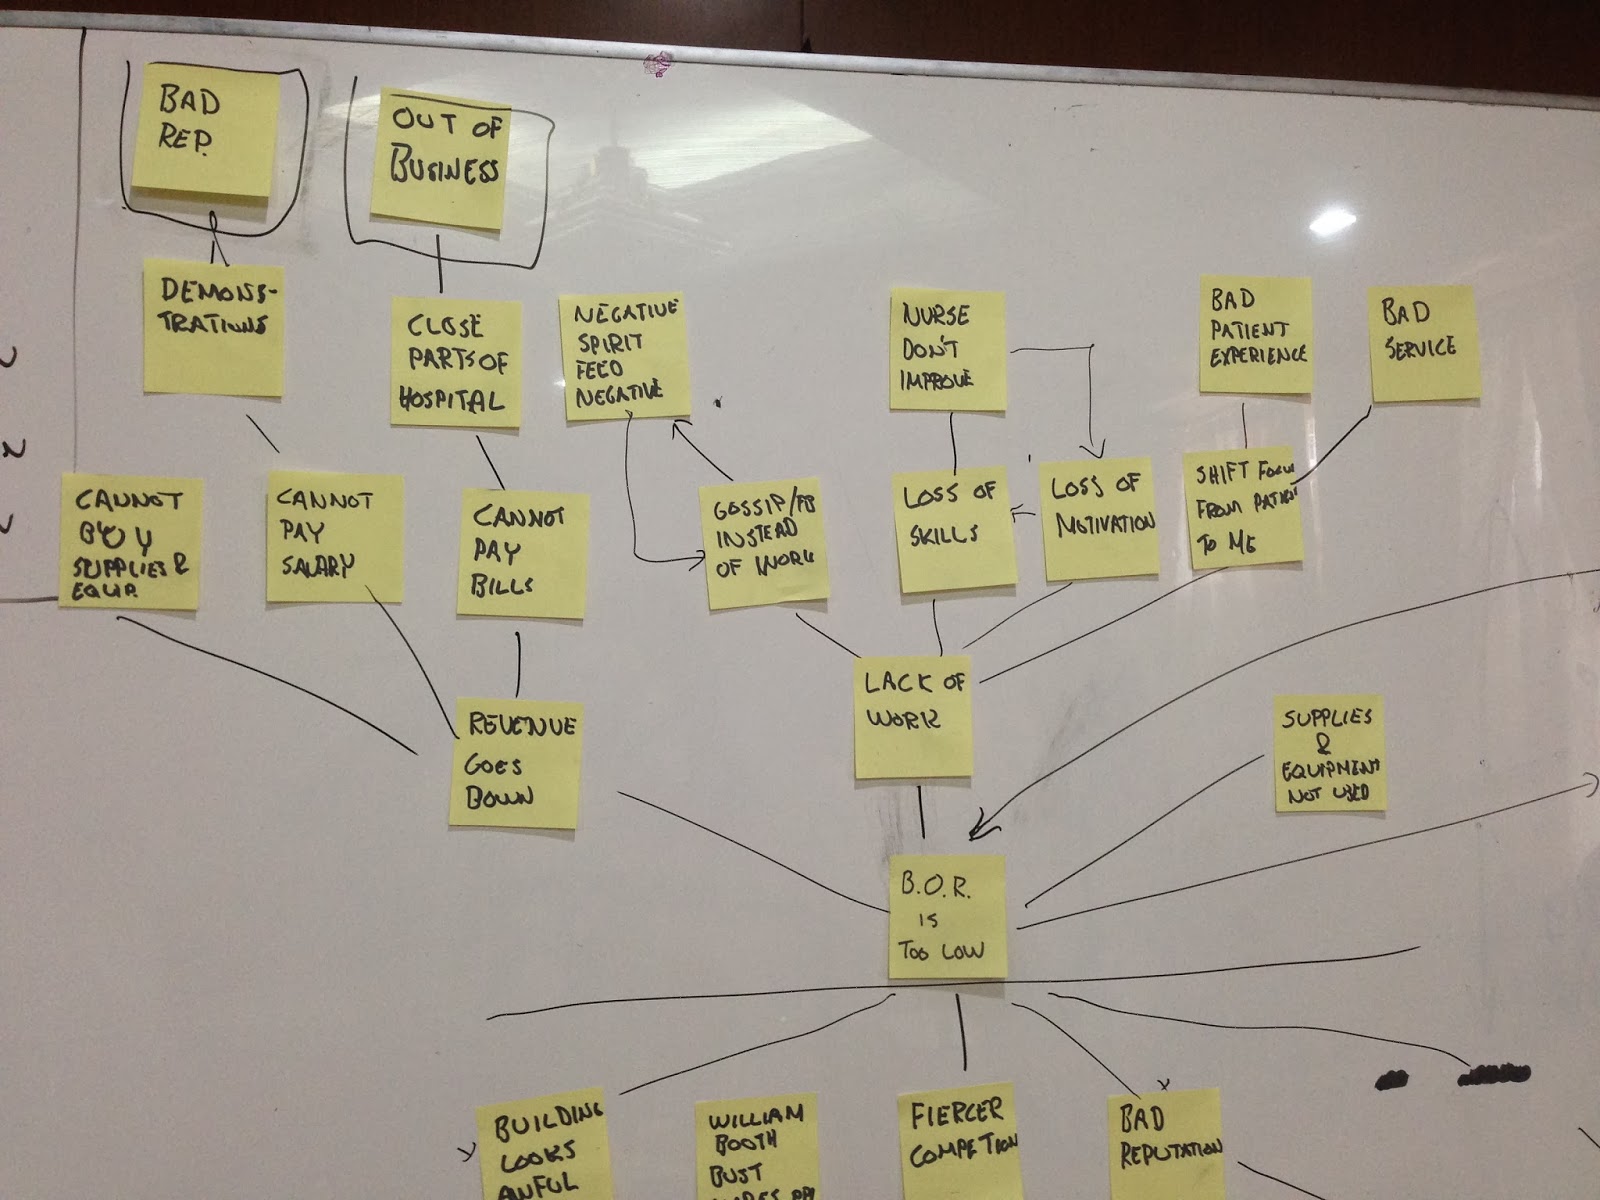
I simply took a sticky and wrote “BOR is too low” on it and stuck it right in the middle of the board. And then we started upwards: “So what? Who cares if our BOR is too low?”. That got them going, I tell you. Before long they had produced this:

I think it took about 1 hour and I did only help them to stay on track in their discussions, trying to remember to address all the branches we created.
We took a step back and looked at the tree we created and realized that we now had a much better understanding of why we need to solve this problem. It touched on some really basic and very important issues that in turn was reinforcing our problem (“BOR is too low”).
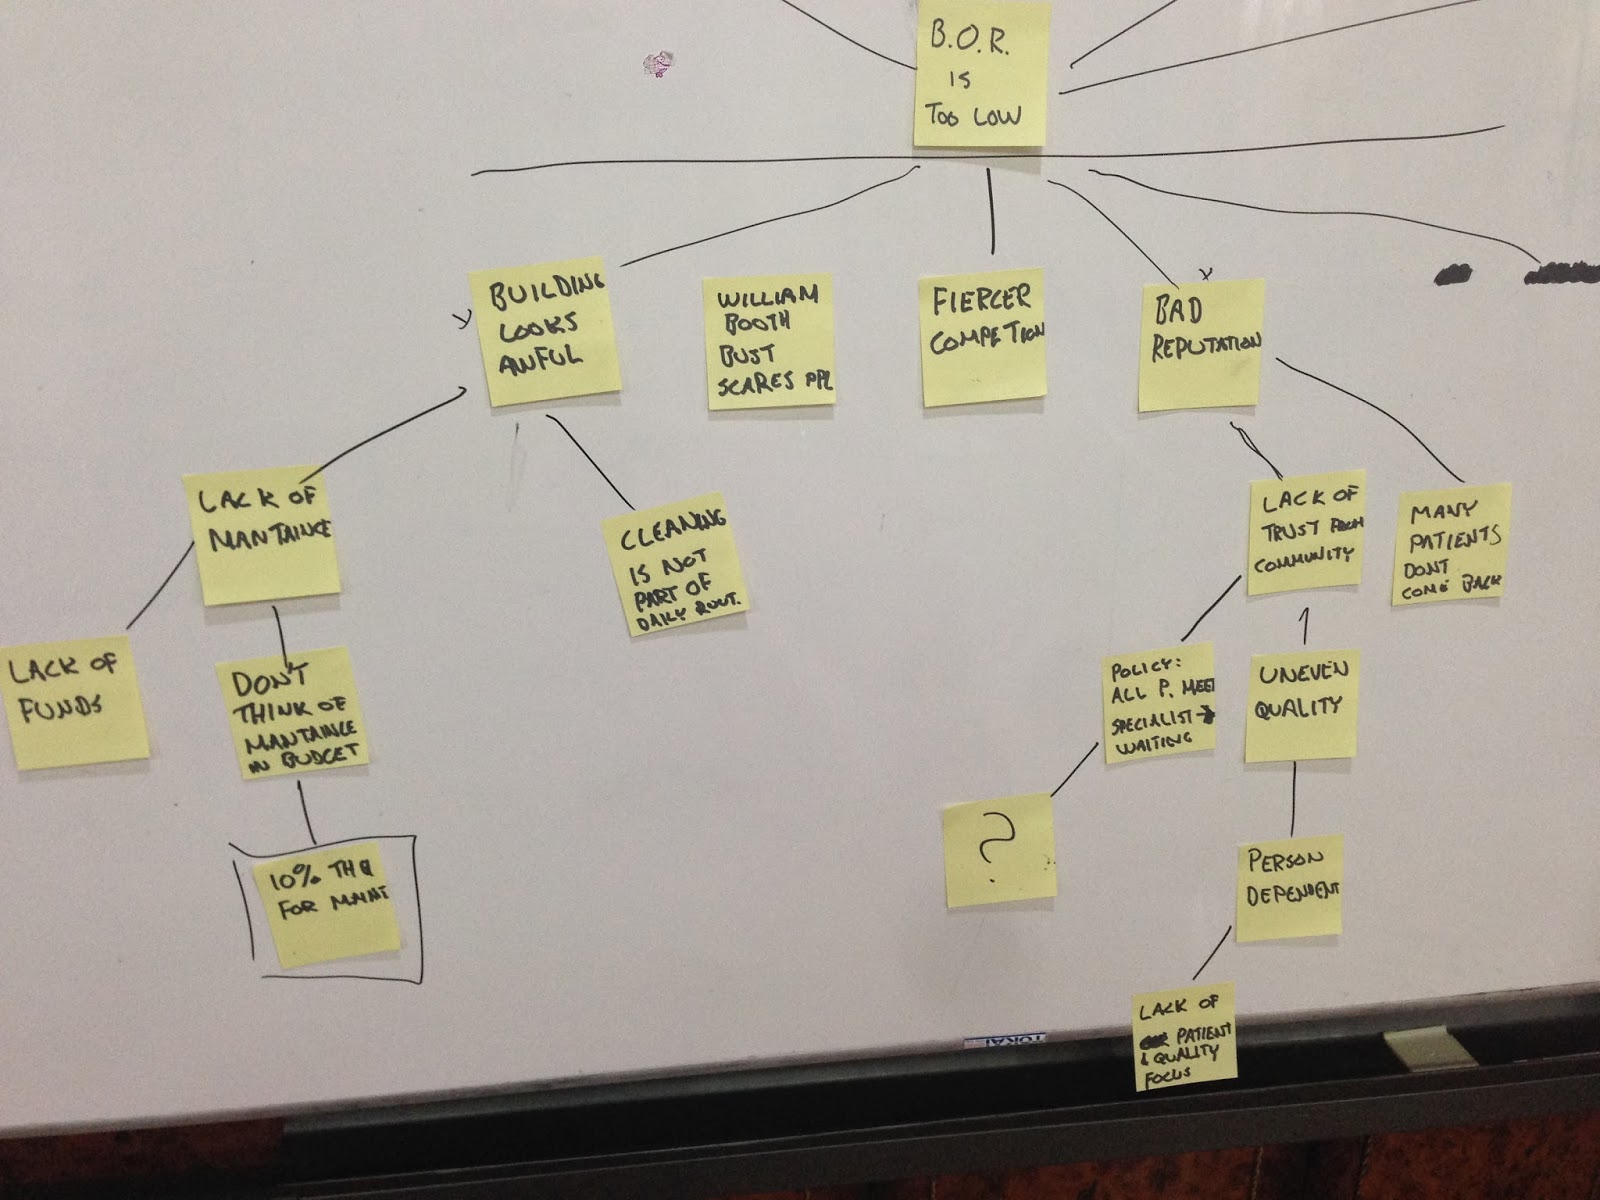
We then worked our way downward asking WHY-questions, as usual. Soon this picture had emerged:

I was a bit disappointed at first, since I was hoping that we would find a single real issue that we all came to realize: This, that’s what we need to address.
But we didn’t. Instead, it was a solid understanding of the problem domain, the reason for that problem to occur, and the consequences of having the problem around.
Impact mapping
I suggested a break, but that’s not how Indonesians do it. They just keep working. I have to try to help them with that.
Without any further ado, we headed right into the next section: Impact mapping.
My thinking here was that given our, now improved, understanding of the problem we could start to formulate a plan for how to turn it around. So we created a sticky called “Increase BOR with 6 ppl / day”. I challenged that.
When I came to Indonesia I reread Switch (yeah, fourth time now) and also ended up talking a lot about getting an F1-question. One of the anecdotes from Switch came to mind and I suggested that we crisp up the goal a bit. So we said “On May 30th, 0900, we will have increased BOR with 6 ppl / day”. They then change that into the real number (like 24 patients a day) which is even better.
With that sticky on the board, I started to ask them who they thought could help us reach this goal. This confused them, so I took the cover of the Impact Mapping book as an example and talked about the racing team and who could help them to win the F1-cup (I’m no F1-guy, but maybe I should start following that…).
That example resonated with them and we got to work again.
I pretty much followed the same way I usually go about creating impact maps, as described here. I tried to stay in one area at the time, first creating breath (all the Who’s first) and then going to the next level (How) per role. Then per How the What’s. That requires some discipline and a facilitator might be needed to not dive too deep and go for the What’s too early. This meeting was just another reaffirmation of the knowledge.
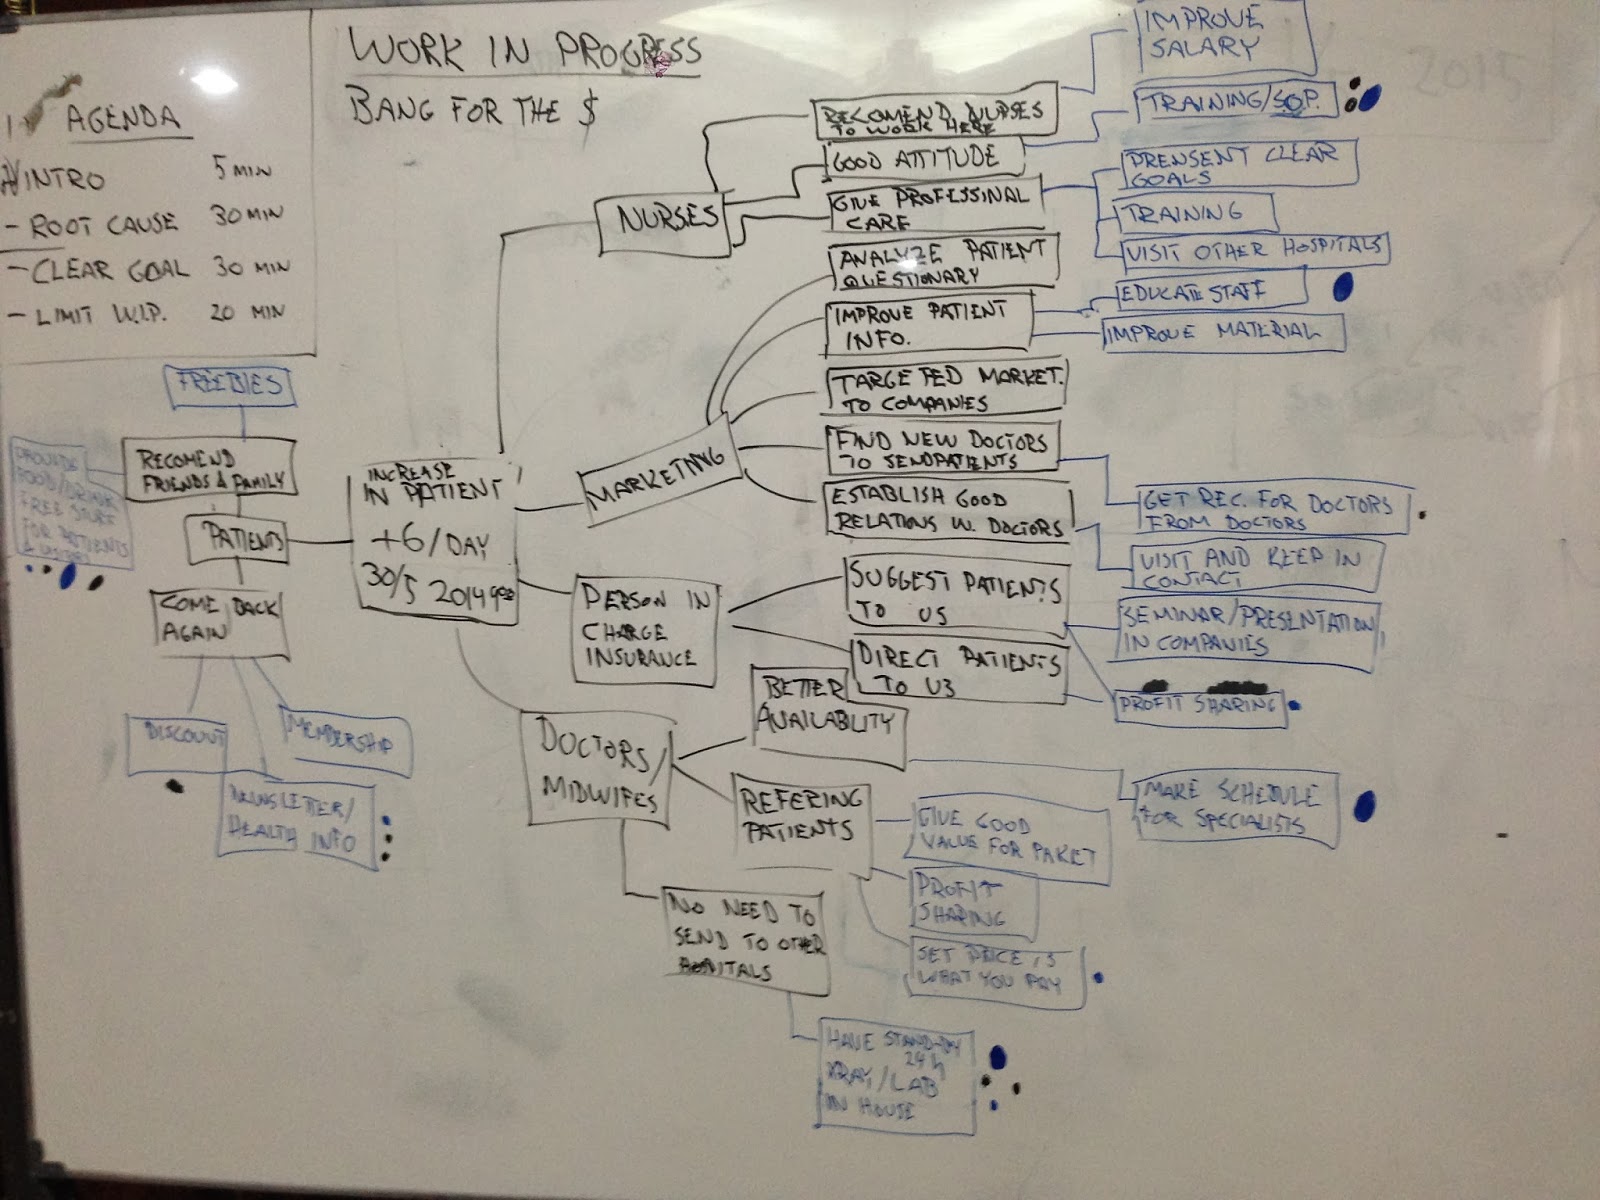
It took quite some time but soon we had an impact map that looked like this:

Yeah, it was a bit messy. And I’ve had this experience quite often when I create maps like these. These are my general tips:
- Get a really big board
- Remember when you start to draw that it will be big and detailed in the end
- Move the What’s to a separate paper or board when you start to talk about it.
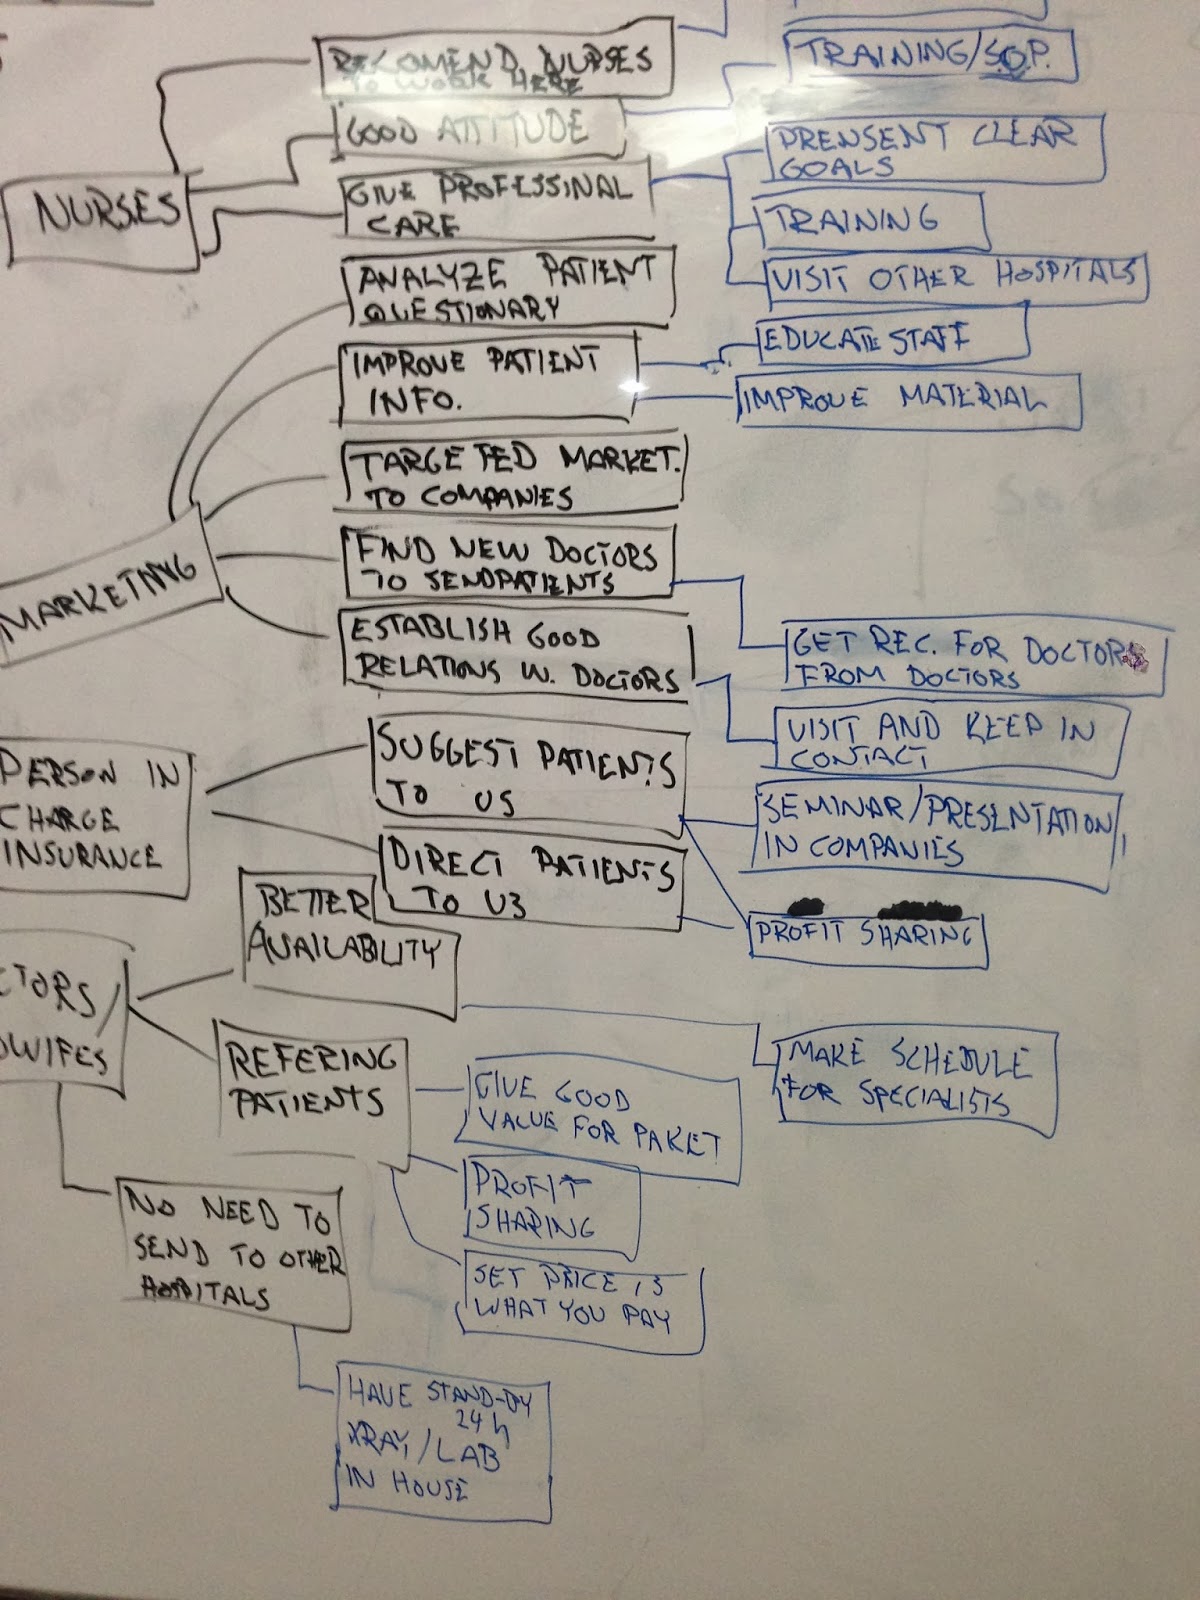
- When you document it. Use something simple, like a phone (these photos are taken with my iPhone 5) and take both overview and detailed pictures.
- Although there are awesome tools out there (looking at you MindMup) there’s really nothing beating standing together in front of a whiteboard. The tactileness and directness is something else. I, for one, like it more.
- That said: do consider moving to a tool after the initial workshop. As documentation for example. Search, navigation, and a lot of other features are very helpful to find stuff in your model.

Limit Work In Progress
And with that, we headed right into selecting a couple of actions. The young doctor was super happy. She would try all of them (35+) and start them tomorrow. The Lean-guy inside me cringed. Violently. I think it showed.
I had to do yet another exercise with them, a simulation to teach them a little bit about why you shouldn’t do too many things at once. We ran the “Learn to count” exercise that I’ve blogged about before (and written about in this free sample chapter from an excellent book). I like this exercise since you can run it with a single person and it’s very to-the-point and gets the message across.
The doctor picked it up fully. After that, we did a Dot vote session to get the top 3 items to start investigating. We wanted “bang for the buck” - the biggest impact with the least effort. They got that too. But still, as we went around the board and voted they were asking me for more dots… :P
Here we could, of course, have gone much more advanced and tried numbers and weights, but this was good enough for now.
Summary
This is as far as I know. The doctor was very happy since she now got a structured problem and an action plan, instead of an unstructured problem and a lot of small activities. That felt really good.
I understood a great deal about what these tools are useful for. It’s maybe not the “get me a list of things to do” or “show me the root cause so that I can fix it”, but rather to give a complete picture and overview. In a visual and direct manner. It’s problem and strategy understanding that is the key point, I think. From that, it’s much simpler to create a plan.
The tools I’ve picked up over many years in the IT sector worked just fine here. Perfect in fact. Maybe our problems aren’t that special after all.